When we are working with a new function, it is useful to know as much as we can about the function: its graph, where the function is zero, and any other special behaviors of the function. We will begin this exploration of linear functions with a look at graphs.
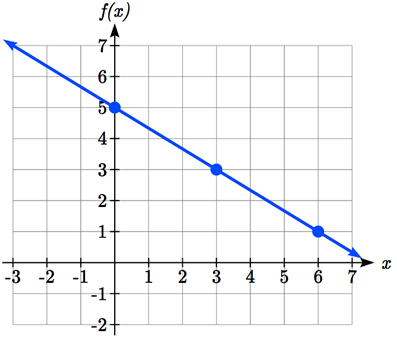
In general, we evaluate the function at two or more inputs to find at least two points on the graph. Usually, it is best to pick input values that will "work nicely" in the equation. In this equation, multiples of 3 will work nicely due to the \(\dfrac{2}{3}\) in the equation, and of course using \(x = 0\) to get the vertical intercept. Evaluating \(f(x)\) at \(x =\) 0, 3 and 6:
These evaluations tell us that the points \((0,5)\text{,}\)\((3,3)\text{,}\) and \((6,1)\) lie on the graph of the line. Plotting these points and drawing a line through them gives us the graph.
When using the initial value and rate of change to graph, we need to consider the graphical interpretation of these values. Remember the initial value of the function is the output when the input is zero, so in the equation \(f(x)=b+mx\text{,}\) the graph includes the point \((0, b)\text{.}\) On the graph, this is the vertical intercept - the point where the graph crosses the vertical axis.
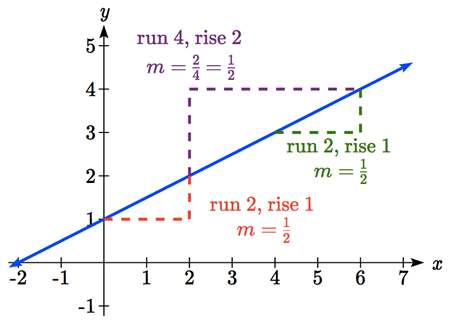
From a graph of a line, this tells us that if we divide the vertical difference of the function outputs by the horizontal difference of the inputs, we will obtain the constant rate of change, also called slope of the line. Notice that this ratio will calculate the same constant rate of change regardless of which two points we use.
\(m\) is the slope of the line and tells us how much we need to increase our output every time we increase the input by 1. We can also generalize this idea to understand that for any change in the input, the corresponding change in the output will be \(m\) times as large. I.e.
\begin{equation*}
\text{change of output/dependent quantity}=m\times \text{(change of input/independent quantity)}.
\end{equation*}
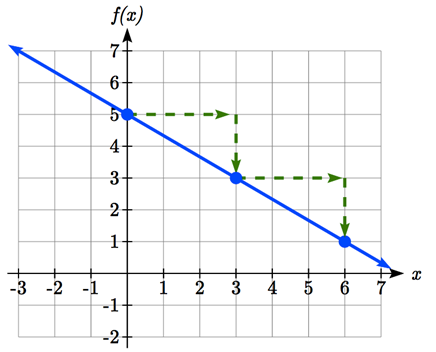
In graphing, we can use this by first plotting our vertical intercept on the graph, then using the slope to find a second point. From the initial value \((0, 5)\) the slope tells us that if we move to the right 3, we will move down 2, moving us to the point \((3, 3)\text{.}\) We can continue this again to find a third point at \((6, 1)\text{.}\) Finally, extend the line to the left and right, containing these points.
Consider that the slope \(\dfrac{-2}{3}\) could also be written as \(\dfrac{2}{-3}\text{.}\) Using \(\dfrac{2}{-3}\text{,}\) find another point on the graph that has a negative \(x\) value.
In addition to understanding the basic behavior of a linear function (increasing or decreasing, recognizing the slope and vertical intercept), it is often helpful to know the horizontal intercept of the function - where it crosses the horizontal axis.
The horizontal intercept of the function is where the graph crosses the horizontal axis. If a function has a horizontal intercept, you can always find it by solving \(f(x) = 0\text{.}\)
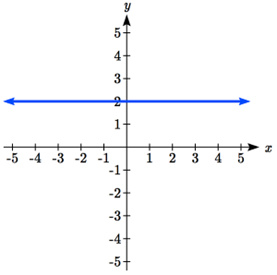
There are two special cases of lines: a horizontal line and a vertical line. In a horizontal line like the one graphed below, notice that between any two points, the change in the outputs is 0. In the slope equation, the numerator will be 0, resulting in a slope of 0. Using a slope of 0 in the \(f(x)=b+mx\text{,}\) the equation simplifies to \(f(x)=b\text{.}\)
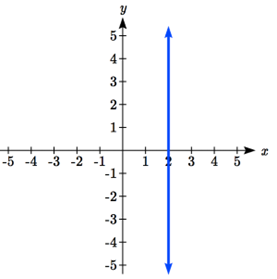
In the case of a vertical line, notice that between any two points, the change in the inputs is zero. In the slope equation, the denominator will be zero, and you may recall that we cannot divide by the zero; the slope of a vertical line is undefined. You might also notice that a vertical line is not a function. To write the equation of vertical line, we simply write input=value, like \(x=a\text{.}\) Notice a vertical line has a horizontal intercept, but no vertical intercept (unless it’s the line \(x = 0\)).
When two lines are graphed together, the lines will be parallel if they are increasing at the same rate - if the constant rates of change are the same. In this case, the graphs will never cross (unless they’re the same line).
We know the line we’re looking for will have the same slope as the given line, \(m = 3\text{.}\) Using this and the given point, we can solve for the new line’s vertical intercept. Starting with \(g(x)=b+3x\text{,}\) we can use the point \((3, 0)\) to get \(0=b+3(3)\text{,}\) and thus \(b=-9\text{.}\)
If two lines are not parallel, one other interesting possibility is that the lines are perpendicular, which means the lines form a right angle (90 degree angle - a square corner) where they meet. In this case, the slopes when multiplied together will equal -1. Solving for one slope leads us to the definition:
Given two linear equations \(f(x)=b_{1}+m_{1} x\) and \(g(x)=b_{2}+m_{2} x\) The lines will be perpendicular if \(m_{1}\times m_{2}=-1\text{,}\) and so \(m_{2}=\dfrac{-1}{m_1}\text{.}\) We often say the slope of a perpendicular line is the "negative reciprocal" of the other line’s slope.
If the original line had slope 2, the perpendicular line’s slope would be \(m_{2}=\dfrac{-1}{2}\text{.}\) If the original line had slope -4, the perpendicular line’s slope would be \(m_{2}=\dfrac{-1}{-4}=\dfrac{1}{4}\text{.}\) If the original line had slope \(\dfrac{2}{3}\text{,}\) the perpendicular line’s slope would be \(m_{2}=\dfrac{-1}{\frac{2}{3}}=\dfrac{-3}{2}\text{.}\)
The original line has slope \(m = 3\text{.}\) The perpendicular line will have slope \(m=\dfrac{-1}{3}\text{.}\) Using this and the given point, we can find the equation for the line. \(g(x)=b-\dfrac{1}{3}x\text{,}\) and at \((3, 0)\text{,}\)\(0=b-\dfrac{1}{3}(3)\text{,}\) so \(b=1\text{.}\)
A line passes through the points \((-2, 6)\) and \((4, 5)\text{.}\) Find the equation of a perpendicular line that passes through the point \((4, 5)\text{.}\)
From the two given points on the reference line, we can calculate the slope of that line: \(m_{1}=\dfrac{5-6}{4-(-2)}=\dfrac{-1}{6}\text{.}\) The perpendicular line will have slope \(m_{2}=\dfrac{-1}{\frac{-1}{6}}=6\text{.}\)
We can then solve for the vertical intercept that makes the line pass through the desired point: \(g(x)=b+6x\text{,}\) then at \((4, 5)\text{,}\)\(5=b+6(4)\) so \(b=-19\text{.}\) Giving the line \(g(x)=-19+6x\text{.}\)
The graphs of two lines will intersect if they are not parallel. They will intersect at the point that satisfies both equations. To find this point when the equations are given as functions, we can solve for an input value so that \(f(x)=g(x)\text{.}\) In other words, we can set the formulas for the lines equal, and solve for the input that satisfies the equation.
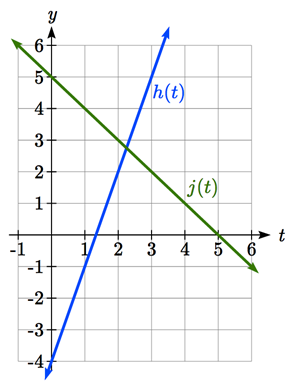
Setting \(h(t)=j(t)\) and solving for \(t\text{,}\) we get
\begin{equation*}
3t-4=5-t,
\end{equation*}
\begin{equation*}
4t=9,
\end{equation*}
\begin{equation*}
t=\dfrac{9}{4}.
\end{equation*}
This tells us the lines intersect when the input is \(\dfrac{9}{4}\text{.}\) We can then find the output value of the intersection point by evaluating either function at this input: \(j(\dfrac{9}{4})=5-\dfrac{9}{4}=\dfrac{11}{4}.\)
To answer this question, it is helpful first to know where the functions are equal, since that is the point where \(h(t)\) could switch from being greater to smaller than \(j(t)\) or vice-versa. From the previous example, we know the functions are equal at \(t=\dfrac{9}{4}\text{.}\) By examining the graph, we can see that \(h(t)\text{,}\) the function with positive slope, is going to be larger than the other function to the right of the intersection. So \(h(t)>j(t)\) when \(t>\dfrac{9}{4}\text{.}\)
\((-3,7)\) found by starting at the vertical intercept, going up 2 units and 3 in the negative horizontal direction. You could have also answered, \((-6, 9)\) or \((-9, 11)\) etc.